Current LED Bar Graph design for Arduino UNO platform uses 16 independently controlled RGB LED’s with integrated WS2812 chip. Similar project is available at this link. In general the voltage is divided into equal intervals equal to the number of LED’s being used . As the input voltage rises the color and the number of active LED’s will change. First 4 green LED’s will turn ON, then 2 yellow and finally 2 red LED’s. You can find a control software for this design at this link.
Doubling a number of segments makes it more sensitive to changes in measured signal down to 300mV instead of 600mV if only 8 LED are operational. In any case these RGB segment modules can be connected in series with small modifications to the code. Here is a schematic of the circuit.
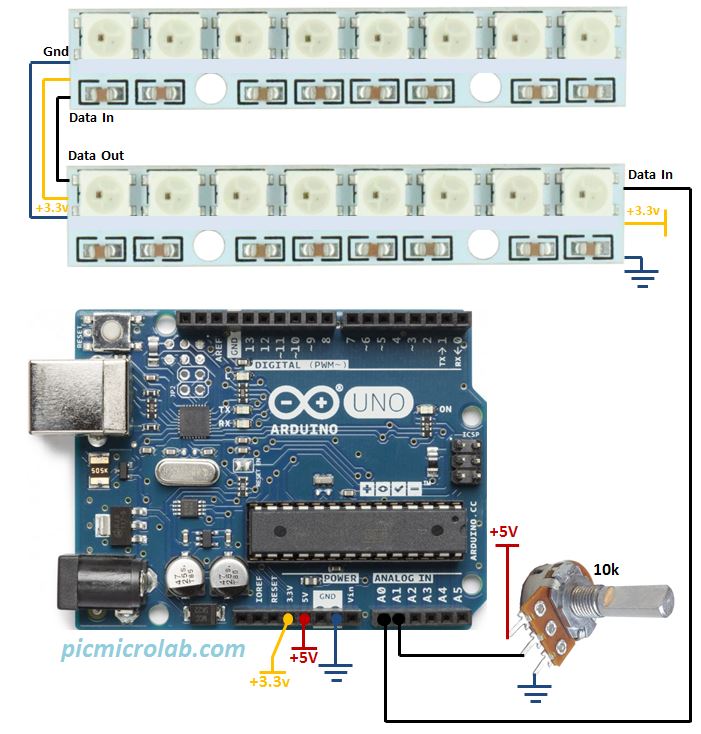
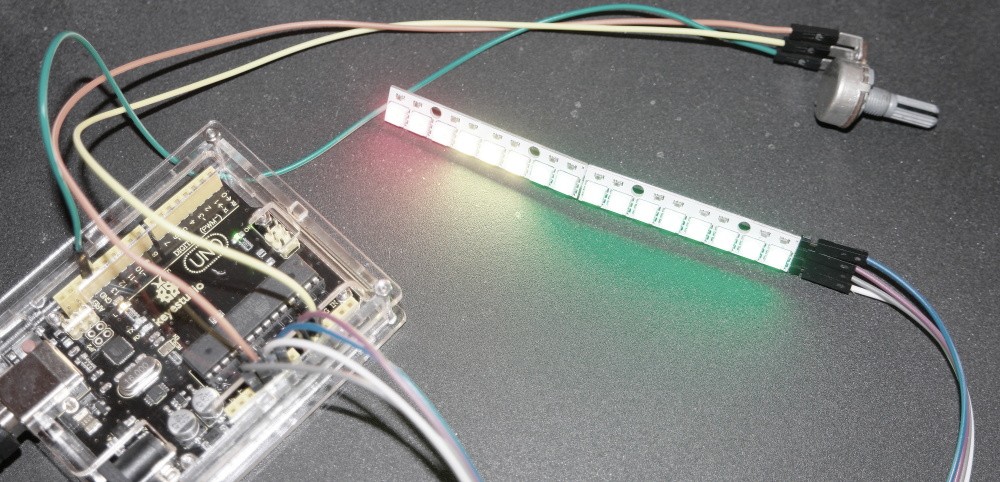
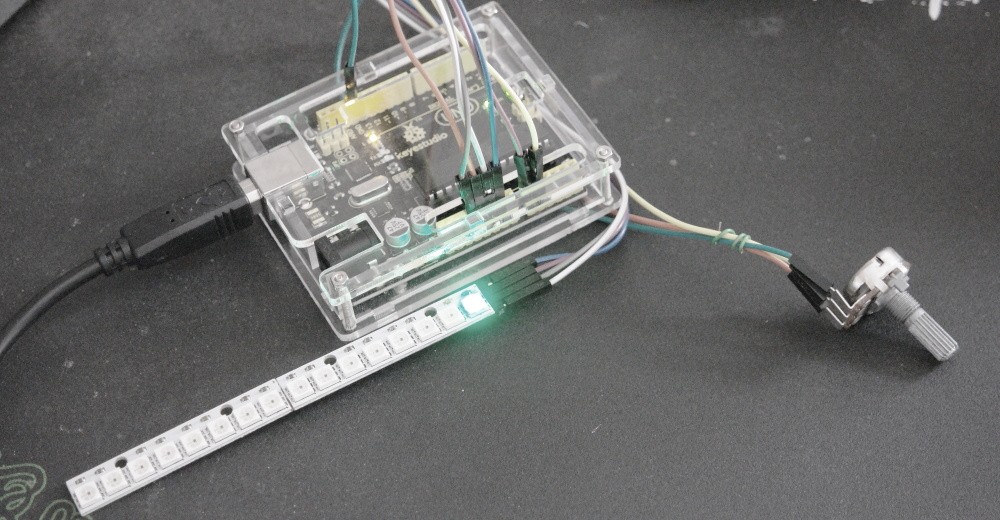
The 10k potentiometer is just for simulating an input signal and can be removed, just make sure that no more than 5v is supplied via A1 analog input. For higher voltages a simple voltage divider can be used. I’ve also made a short video showing bar graph prototype operation.